Why We Rebuilt the ShipIn Website
.png)
The product advanced, and the website had to catch up
When ShipIn launched FleetVision, the hardest problem was explanation. Turning onboard video into operational intelligence was a genuinely unfamiliar idea, and the website reflected that. It walked visitors through what the system was, how it worked, and why that mattered. That framing was necessary. The primary barrier was understanding.
That barrier no longer exists.
FleetVision is running across fleets today. Operators are not asking what it does. They are asking how well it reflects their reality, how reliably it surfaces what matters, and whether it can support better decisions across all the vessels they run. The conversation has matured, and the old website had not kept pace. It explained the concept accurately but stopped short of showing the system in operation. How it fits inside a working fleet, what it actually produces, and what changes as a result.
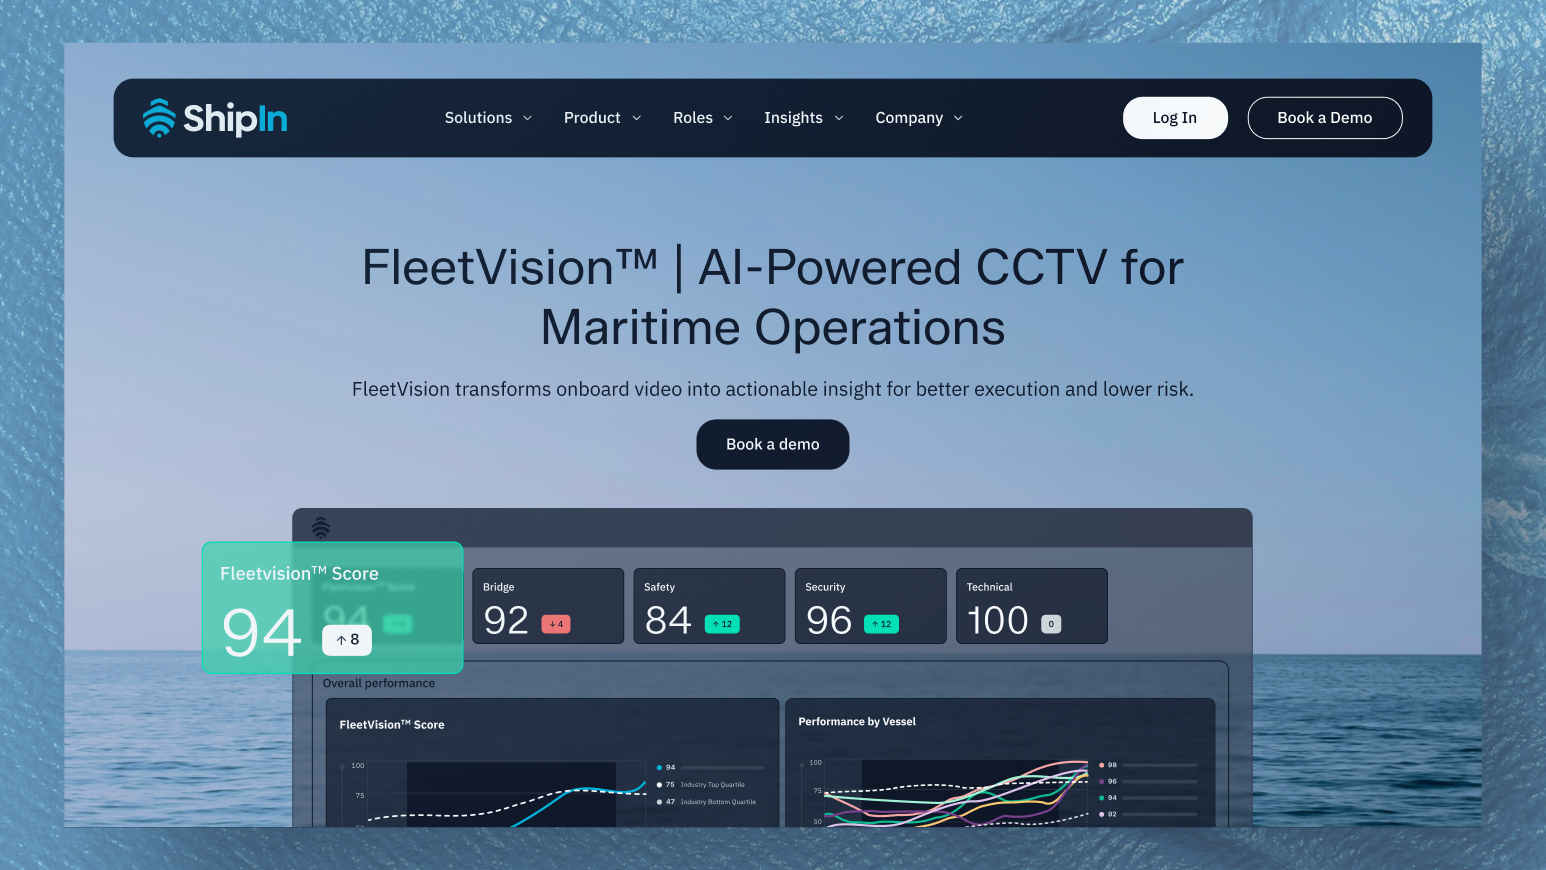
A website built to reflect the fleet
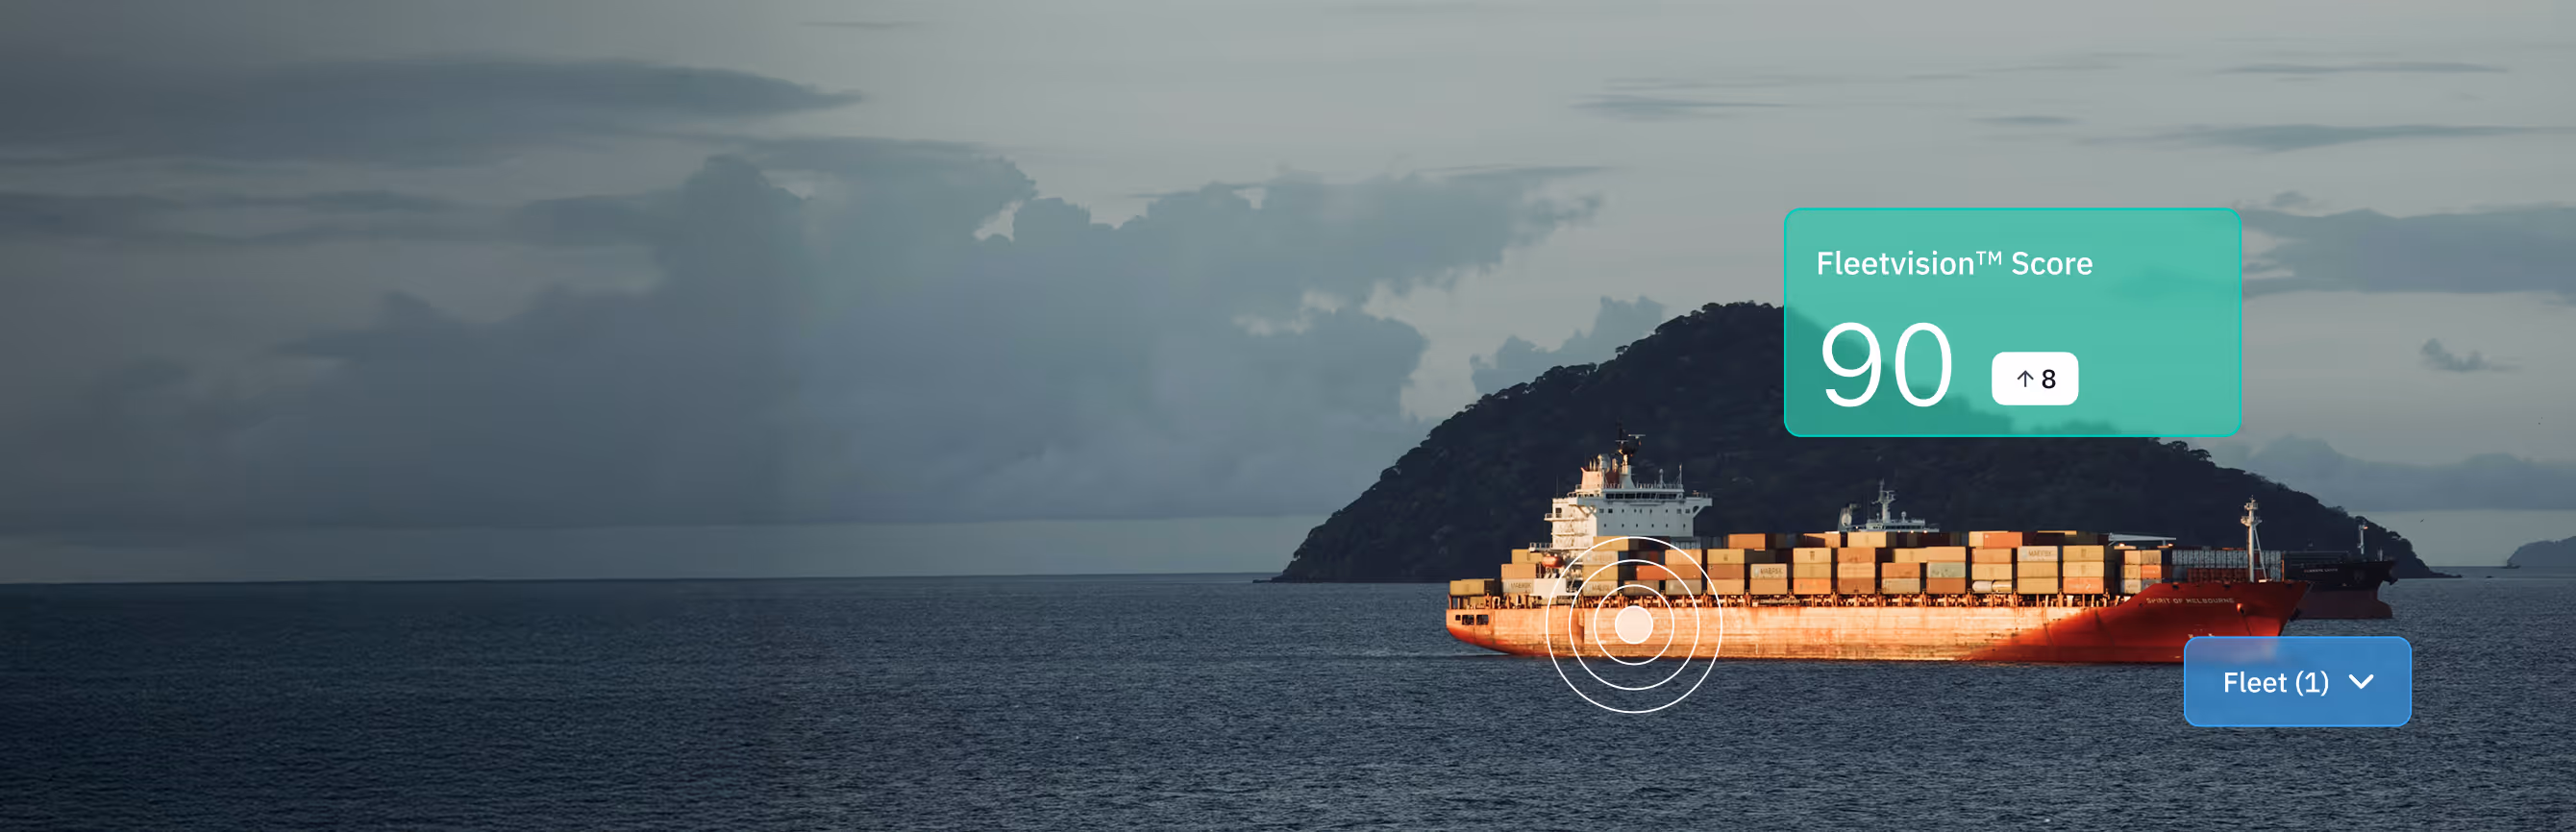
The new site is structured around operational reality rather than features or technical architecture. Each section maps to the areas that FleetVision primarily covers: the bridge, deck, and engine room. It shows how activity in those areas is continuously observed, interpreted, and turned into signals that travel across the fleet.
Those signals do not exist in isolation. They connect into a complete picture. One that crews onboard and teams onshore can read from the same source without translating between systems or manually filling gaps. A deviation flagged at 2 am on a vessel in the North Sea reaches the same dashboard as performance patterns tracked across a fleet of thirty ships. The view is consistent because the underlying process is consistent.
Showing that coherence, rather than listing the capabilities that produce it, is what the new site is designed to do.
A clear distinction from cameras
Most vessels already have cameras. The footage exists. What has been missing is any systematic way to make sense of it.
FleetVision adds continuous interpretation. Every hour of activity is evaluated in context, processed into structured data that reflects what actually happened and what it means for how the vessel is being run. Over time, those signals accumulate into a reliable picture of performance, risk, and consistency that no manual process can match at scale.
This distinction matters because without it, FleetVision looks like an incremental upgrade to existing infrastructure. It is a different category of tool, one that shifts how operational knowledge is generated and where it lives.
Reflecting outcomes as part of the product
FleetVision has been running long enough to produce measurable results. Fleets using it have changed how they operate, not because they were told to, but because the system made previously invisible patterns visible.
Those outcomes are not treated as testimonials or proof points sitting outside the product story. They are part of it. When a system consistently influences behavior and performance, that impact belongs in how the product is understood, not in a separate case study section that most visitors never reach.
The visual direction, structure, and language all changed because the product itself changed. In what it does, in the scale at which it operates, and in what operators now expect from it.
FleetVision is built to reflect the full reality of fleet operations. The website now does the same. Not describing what the system could do in theory, but showing what it does, every day, across the fleets that depend on it.